GraphicsData
All graphics objects are defined by a GraphicsData structure.
Note that currently the visualization is based on a very simple and ancient OpenGL implementation, as there is currently no simple platform independent alternative. However, most of the heavy load triangle-based operations are implemented in C++ and are realized by very efficient OpenGL commands. However, note that the number of triangles to represent the object should be kept in a feasible range (\(<1000000\)) in order to obtain a fast response of the renderer.
Many objects include a GraphicsData dictionary structure for definition of attached visualization of the object.
Note that objects expect a list of GraphicsData, which can be produced with exudyn.graphics. ... functions (until Exudyn 1.8.33 with GraphicsData...(...), which are now deprecated).
Note that if reading out the GraphicsData from the object again, it usually has a different structure sorted by types of GraphicsData.
Typically, you can use primitives (cube, sphere, …) or STL data to define the objects appearance.
GraphicsData dictionaries can be created with functions provided in the utility module exudyn.graphics, see Section Module: graphics.
GraphicsData can be transformed into points and triangles (mesh) and can be used for contact computation, as well.
NOTE that for correct rendering and correct contact computations, all triangle nodes must follow a strict local order and triangle normals – if defined – must point outwards, see Fig. 14.
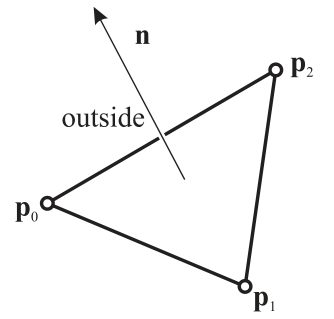
Fig. 14 Definition of triangle normals and outside/inside regions in Exudyn
The normal to a triangle with vertex positions \({\mathbf{p}}_0\), \({\mathbf{p}}_1\), \({\mathbf{p}}_2\) is computed from cross product as \({\mathbf{n}} = \frac{({\mathbf{p}}_1-{\mathbf{p}}_0) \times ({\mathbf{p}}_2-{\mathbf{p}}_0)}{|({\mathbf{p}}_1-{\mathbf{p}}_0) \times ({\mathbf{p}}_2-{\mathbf{p}}_0)|}\); the normal \({\mathbf{n}}\) then points to the outside region of the mesh or body; the direction of \({\mathbf{n}}\) just depends on the ordering of the vertex points (interchange of two points changes the normal direction); correct normals are needed for contact computations as well as for correct shading effects in visualization.
BodyGraphicsData
BodyGraphicsData contains a list of GraphicsData items, i.e. bodyGraphicsData = [graphicsItem1, graphicsItem2, ...]. Every single graphicsItem may be defined as one of the following structures using a specific ‘type’.
The following sections show the different possible types of GraphicsData.
GraphicsData: Line
GraphicsData 'type' = 'Line' draws a polygonal line between all specified points:
Name
|
type
|
default value
|
description
|
|---|---|---|---|
color
|
list
|
[0,0,0,1]
|
list of 4 floats to define RGB-color and transparency
|
data
|
list
|
mandatory
|
list of float triples of x,y,z coordinates of the line floats to define RGB-color and transparency
|
Example:
#rectangle with side length 1:
graphicsData = {'type':'Line',
                'color': [1,0,0,1], #red
                'data': [0,0,0,
                         1,0,0,
                         1,1,0,
                         0,1,0,
                         0,0,0]}

vGround=VObjectGround(graphicsData=[graphicsData])
oGround=mbs.AddObject(ObjectGround(referencePosition= [0,0,0],
                                 visualization=vGround))
Certainly this can be done much more elegant and shorter with graphics.Lines:
import exudyn.graphics as graphics
graphicsData = graphics.Lines([[0,0,0],[1,0,0],[1,1,0],[0,1,0],[0,0,0]],
                              color=graphics.color.red)
GraphicsData: Lines
GraphicsData 'type': 'Lines' draws a list of \(n\) lines defined by 2 points each:
Name
|
type
|
default value
|
description
|
|---|---|---|---|
colors
|
list
|
mandatory
|
list [R0,G0,B0,A0, R1,G2,B1,A1, …] of \(2\times n\) x 4 floats to define RGB-color and transparency of line points
|
points
|
list
|
mandatory
|
list of \(2 \times n\) float triples of x,y,z coordinates of the line points; Example for two lines: data=[0,0,0, 1,0,0, 1,0,0, 1,1,0] … draws a L-shape with side length 1
|
GraphicsData: Circle
GraphicsData 'type' = 'Circle' draws a polygonal line between all specified points:
Name
|
type
|
default value
|
description
|
|---|---|---|---|
color
|
list
|
[0,0,0,1]
|
list of 4 floats to define RGB-color and transparency
|
radius
|
float
|
mandatory
|
radius of circle
|
position
|
list
|
mandatory
|
list of float triples of x,y,z coordinates of center point of the circle
|
Example:
graphicsData = {'type':'Circle',
                'color': [0,0,1,1],  #blue
                'radius': 0.5,
                'position':[2,3,0]}
GraphicsData: Text
GraphicsData 'type' = 'Text' places the given text at position:
Name
|
type
|
default value
|
description
|
|---|---|---|---|
color
|
list
|
[0,0,0,1]
|
list of 4 floats to define RGB-color and transparency
|
text
|
string
|
mandatory
|
text to be displayed, using UTF-8 encoding (see Section Character encoding: UTF-8)
|
position
|
list
|
mandatory
|
list of float triples of [x,y,z] coordinates of the left upper position of the text; e.g. position=[20,10,0]
|
GraphicsData: TriangleList
GraphicsData 'type' = 'TriangleList' draws a mesh with flat triangles for given points and connectivity; triangles may look smoothened by using appropriate normals; edges may be added optionally:
Name
|
type
|
default value
|
description
|
|---|---|---|---|
points
|
list
|
mandatory
|
list [x0,y0,z0, x1,y1,z1, …] containing \(n \times 3\) floats (grouped x0,y0,z0, x1,y1,z1, …) to define x,y,z coordinates of points, \(n\) being the number of points (=vertices)
|
colors
|
list
|
[]
|
list [R0,G0,B0,A0, R1,G2,B1,A1, …] containing \(n \times 4\) floats to define RGB-color and transparency A of triangle vertices (points), where \(n\) must be according to number of points; if field ‘colors’ does not exist, default colors will be used
|
normals
|
list
|
[]
|
list [n0x,n0y,n0z, …] containing \(n \times 3\) floats to define normal direction of triangles per point, where \(n\) must be according to number of points; if field ‘normals’ does not exist, default normals [0,0,0] will be used
|
triangles
|
list
|
mandatory
|
list [T0point0, T0point1, T0point2, …] containing \(n_{trig} \times 3\) integers to define point indices of each vertex of the triangles (=connectivity); point indices start with index 0; the maximum index must be \(\le\) points.size()
|
edges
|
list
|
[]
|
list [L0point0, L0point1, L1point0, L1point1, …] containing \(n_{lines} \times 2\) integers to define point indices of edges drawn on triangle mesh
|
edgeColor
|
list
|
[0,0,0,1]
|
list of 4 floats to define RGB-color and transparency of edges
|
Examples of GraphicsData can be found in the Python examples and in the file graphics.py, see Section Module: graphics.